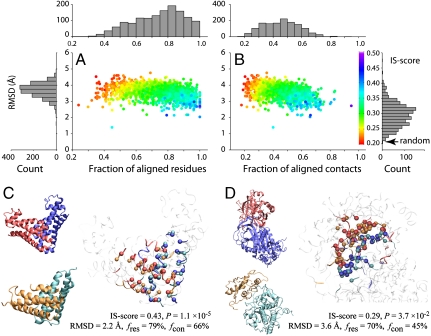
Fig. 3.
The closest matching artificial interface to each of the native interfaces from PDB150. Scatter plots of rmsd for interfacial residues aligned between two interfaces versus (A) fraction of aligned residues fres and (B) fraction of aligned contacts fcon. Each point is color-coded according to the IS-score. Histograms of rmsd, fres, and fcon are shown in bar plots. Two examples are shown: (C) HI0074 (PDB and chain IDs: 1jog_AB), where the monomer structures of the artificial and real structures are similar, and (D) thrombin/antithrombin (1tb6_HI), where the closest monomer structures are dissimilar. The experimental and model complexes are shown in blue/red and cyan/orange, respectively. The Right snapshot shows the optimal interface alignment reported by iAlign; the Cα atoms of aligned residues are shown in a Van der Waals representation, and the noninterface regions are dimmed.

