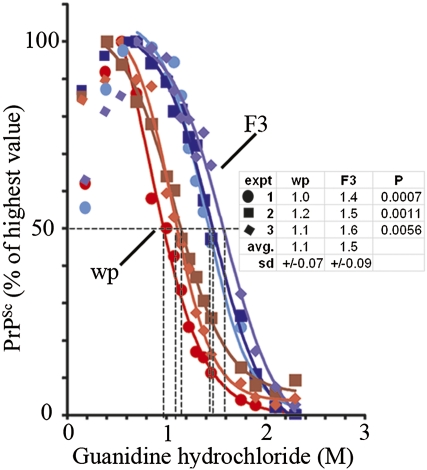
Fig. 3.
Different conformational stabilities of PrPSc from R33[22L]wp-P0 and R33[22L]F3 cells. Lysate samples were exposed to the guanidinium chloride concentrations indicated for 15 min at 25 °C and, after guanidinium was adjusted to 0.2 M, were digested with proteinase K and analyzed by Western blotting. The signals were quantified as described in SI Methods. The curves were obtained from three independent experiments. In some cases, there was an increase in signal intensity after exposure to low guanidinium and proteinase K digestion, ascribed to increased exposure of epitope. The highest signal was set to 100%. The Gnd1/2 values averaged from three experiments were 1.1 M and 1.5 M for PrPSc from R33[22L]wp-P0 and R33[22L]F3 cells, respectively.

