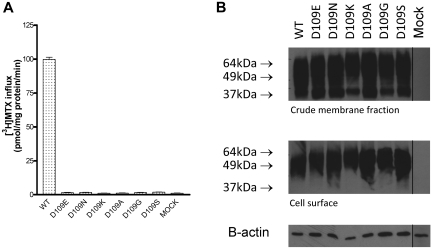
Figure 6.
Functional properties of D109 PCFT mutants. (A) [3H]-MTX influx (0.5μM) over 1 minute at pH 5.5. Data are the mean ± SEM from 3 independent experiments. (B) Western blot assay of the crude cell-membrane fraction (top panel) and biotinylated protein (middle panel) of D109 PCFT mutants. β-actin was the loading control (bottom panel). The graph shown is a representative of 2 independent experiments. The vertical line between the D109S and Mock lanes indicates repositioned gel lanes.

