
Figure 2.
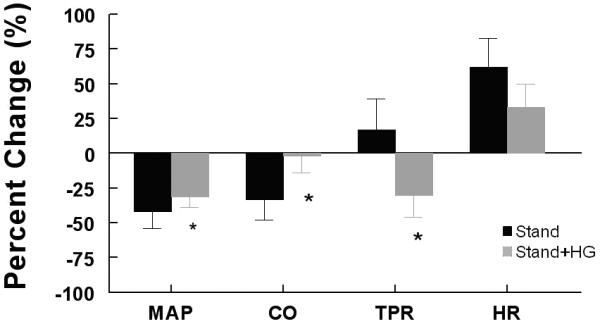
Percent change of MAP, HR, TRP and CO averaged over all subjects. Stand alone is in black, stand + HG is in grey. HG blunts the decrease in MAP, eliminates the decrease in CO and reverses the change in TPR such that TPR increases on average with stand alone, but decreases on average after HG.