Figure 2.
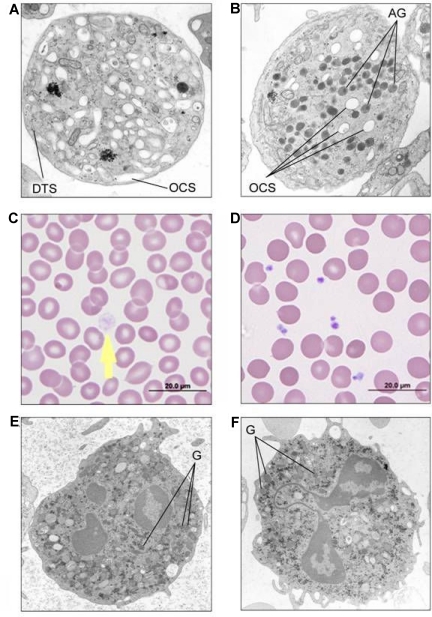
Platelet and neutrophil images of GPS patients in comparison with controls. (A) EM of thin sections of a platelet from patient 1(V-20) showing absence of α-granules and abundant channels of the open canalicular system (labeled as OCS) in comparison with EM of a control platelet (B) showing normal alpha granules (labeled as AG). DTS: Dense tubule system. (C) Light microscopy of the peripheral smear of GPS patient 1(V-20) showing a large pale gray platelet (arrow) without the cytoplasmic color of α-granules, in comparison with a normal smear (D). (E) EM of a neutrophil of GPS patient 11(II-1) showing normal cytoplasmic granules (labeled as G) similar to control neutrophil from a normal volunteer (F); Phillips 301 Electrone microscope.

