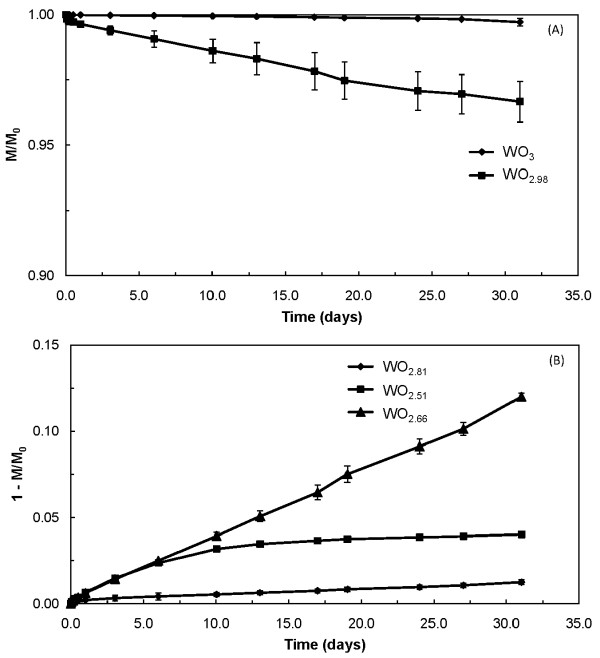
Figure 2.
Plots of tungsten oxide powder dissolution for the as-received state in phagolysosomal simulant fluid. (A) isometric-shaped WO3 and WO2.98 powders illustrating single-phase dissolution that was best described by a single negative exponential. Dissolution parameters were calculated using a surface-area-limited dissolution model [33]. Note that the y-axis scale is mass fraction remaining (M/M0) and plotted values from 0.90 to 1.0 to illustrate the shape of the curves. (B) fiber-containing WO2.81, WO2.66, and WO2.51 powders; WO2.81 and WO2.51 illustrate biphasic dissolution that was described by two negative exponentials (the first for the initial rapid dissolution phase and the second for the latter long-term phase) whereas WO2.66 was best described by a single negative exponential. Dissolution parameters for the fiber-containing materials were calculated using a constant dissolution velocity model [34]. Note that the y-axis is 1 - (M/M0) and plotted values range from 0.0 to 0.15 to illustrate the shapes of the curves; hence, the fraction of material dissolved during the initial phase was low, usually less than 2% of the total.

