
Figure 2.
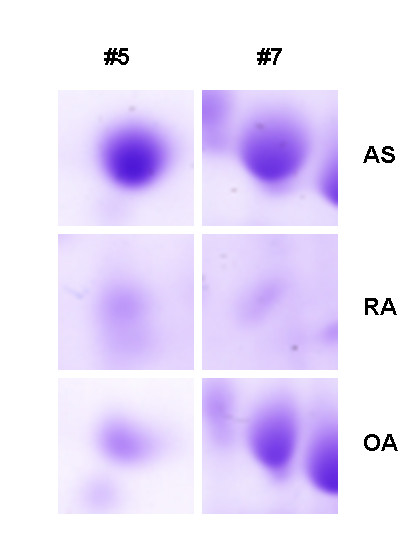
Comparison of the AS, RA and OA synovial proteins indicated by numbers in Figure 1. Protein spots (#5 and #7) from the AS synovial tissue had 3-fold higher expression levels than the matched spots from RA and OA synovium.
Official websites use .gov
A
.gov website belongs to an official
government organization in the United States.
Secure .gov websites use HTTPS
A lock (
) or https:// means you've safely
connected to the .gov website. Share sensitive
information only on official, secure websites.
Comparison of the AS, RA and OA synovial proteins indicated by numbers in Figure 1. Protein spots (#5 and #7) from the AS synovial tissue had 3-fold higher expression levels than the matched spots from RA and OA synovium.