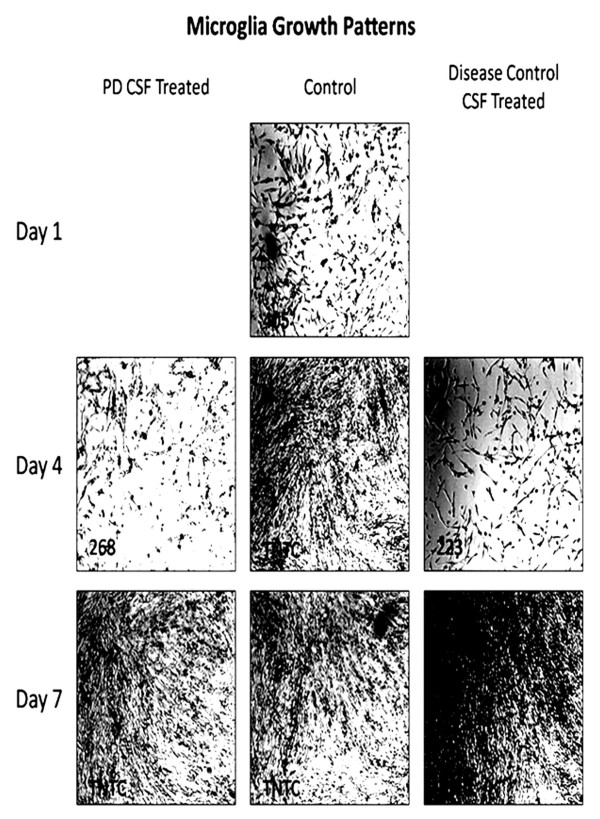
Figure 1.
Photographs of cell growth of cultured microglia showing that by day 4, controls had grown to confluence, whereas PD-CSF treated cells had not. Disease (neurological) control CSF treated cells had a reduced growth rate. After addition of fresh growth medium (Day 7) all cell groups showed substantial growth. Cell count per frame is in lower left corner; TNTC = too numerous to count. Magnification ×100.

