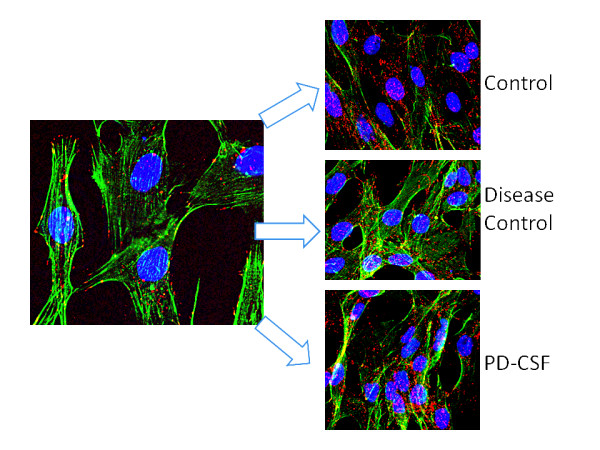
Figure 3.

Fluorescence deconvolution microscopy images showing an increased density of α-synuclein in microglia following PD-CSF treatment, but not in neurological disease control CSF and no-CSF controls. Red = α-synuclein; blue = DAPI (nuclei); green = filamentous actin. Magnification ×600.
