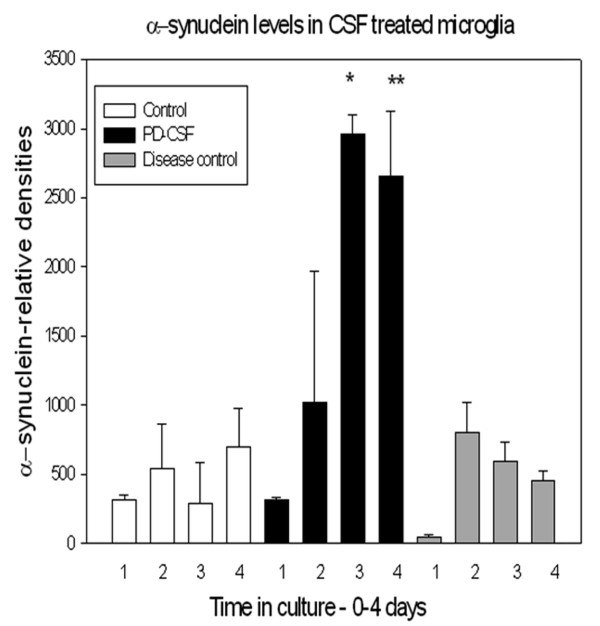
Figure 5.
Histogram to show changes in α-synuclein content of cultured microglial cells for all treatment groups over consecutive days 1-4. Treatment with PD-CSF resulted in significant increases of α-synuclein content Day 3 *, Day 4 **; (p < 0.02) when compared to control and neurologic disease control CSF treated cells (n = 8).

