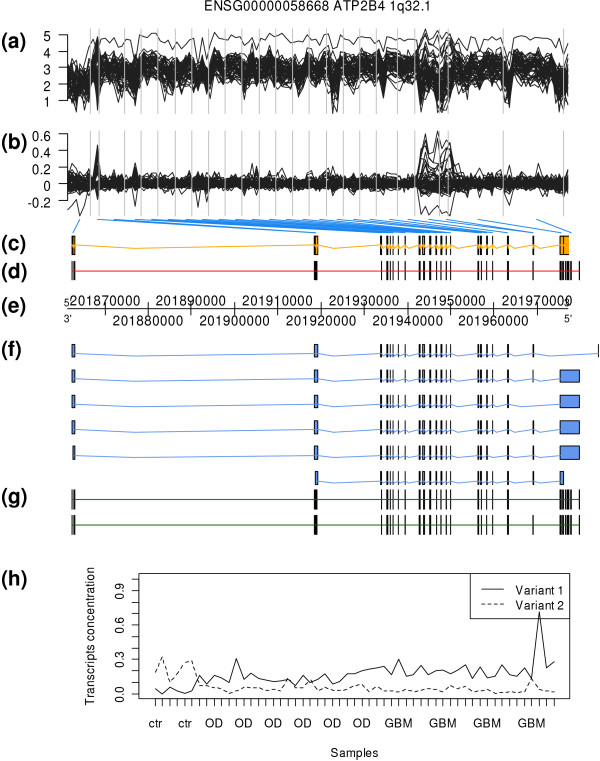
Figure 5.
Results for ATP2B4 gene (data from GSE9385). The content of each panel is explained in figure 4. (f) In Ensembl release 51 there are six different annotated transcripts. (g) The predicted number of transcripts using SPACE is two and their predicted structure is shown. A cassette event of one exon toward the 5' end of the gene is clearly identified. (h) Estimated concentration of each of the two transcripts (variant 1 and 2) in each sample. Samples 1 to 6 correspond to normal tissue, samples 7 to 32 to oligodendroglioma and samples 33 to 55 to glioblastoma multiform. The results for the estimation of the concentrations are the reverse of RT-PCR results.

