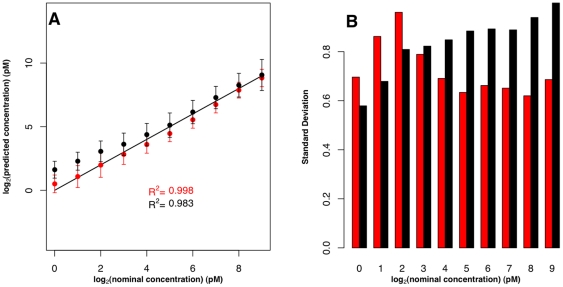
Figure 1. Estimation of transcript concentrations on the Affymetrix platform: Comparison to hybridization model-based approach.
Estimations of 19 transcripts chosen by Li et al. (A) Results obtained from a training set of three probesets for GLAM (red) and those obtained from Li et al. approach (black). Error bars are standard deviations. The solid line is the identity line (x = y). (B) Comparison of error bar lengths for each concentration for our approach (red) and the Li et al. approach (black).

