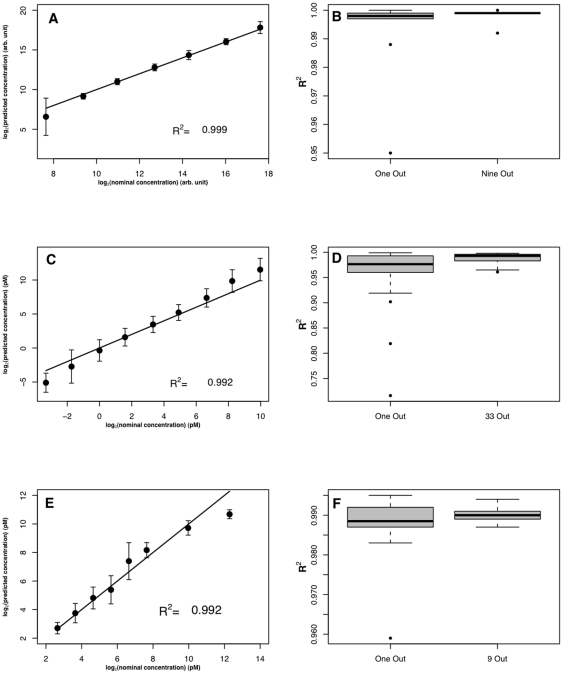
Figure 3. Estimation of transcript concentrations on the Agilent platform (A and B), Illumina platform (C and D) and pin-spotted platform (E and F).
The first column shows results obtained from a comprehensive leave-one-out procedure. Error bars are the standard deviations of the ten transcripts. The solid line is the identity line (x = y). The second column shows box plots of R2 for the ten (Agilent), thirty three (Illumina) and ten (pin-spotted) estimations of leave-one-out procedure and R2 for five estimations of leave-nine-out (Agilent), leave-33-out (Illumina) and leave-nine-out (pin-spotted) procedures.

