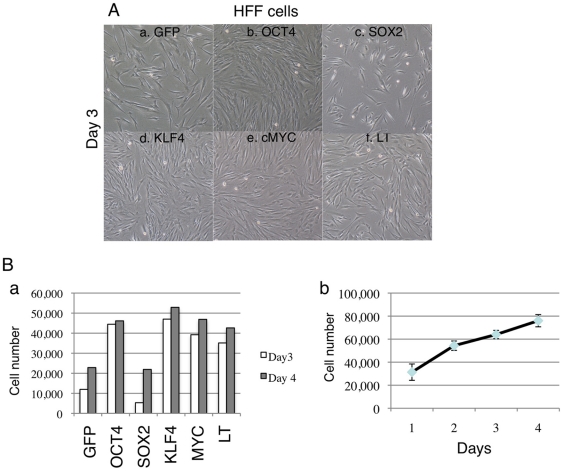
Figure 4. Cell survival study following mRNA transfection.
(A) Morphology of cells transfected with each reprogramming factor. (B–a) Bar graph of cell number 3 and 4 days after mRNA transfection. Note that SOX2 group has much fewer cells than other groups. (B–b) Growth curve of MRC5 cells undergone microporation but no mRNA was added.

