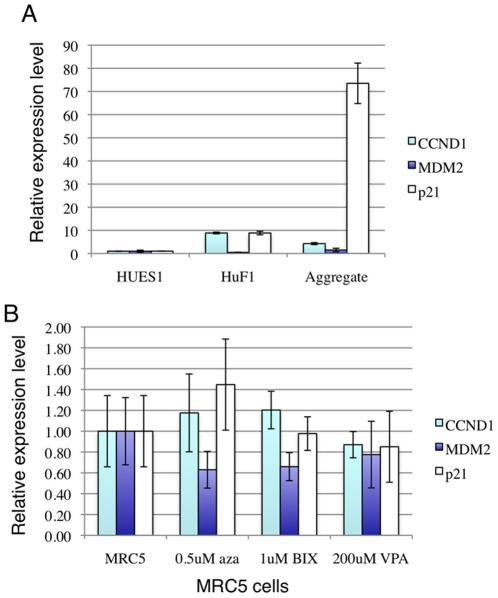
Figure 8. Q-PCR analysis of cell cycle and DNA damage response genes.
All values were normalized against GAPDH. (A) p21 RNA was markedly up-regulated in cell aggregates. The expression values in HUES1 ES cells were set as “1”. (B) The expression levels of CCND1, MDM2 and p21 were not significantly altered by any of the small molecules. The expression values in DMSO treated MRC5 cells were set as “1”.

