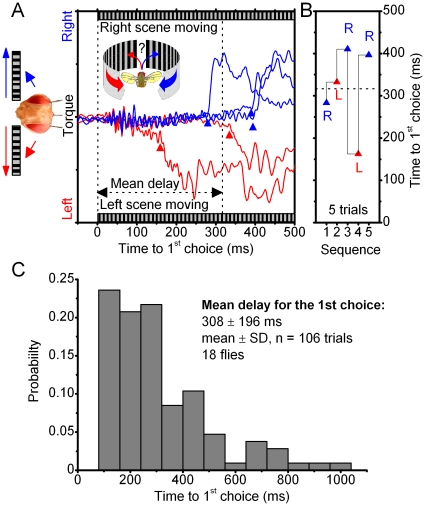
Figure 3. Time-to-choice varies greatly during competing stimulation.
(A) A tethered fly is flying in the flight arena, when suddenly the identical scenes on its left and right, are made to move together at the moment of t = 0 (60°/s). It takes on average 316.6±100.4 ms (mean ± SD, n = 5) before the fly begins to react either to the left (red triangle) or right (blue triangle) scene, as measured by time-to-choice of its first switch-like torque responses. The scenes were stopped and started again with tens of seconds between the trials. These orientation responses are highly variable. The double-headed arrow (black) stretches out the mean delay for this fly. (B) Its first responses were either to left (red triangle) or right (blue triangle), showing no side-preference and with time-to-onset, or wait-period, varying from one trial to another (14/18 flies behaved this way). Other flies preferred one stimulus over its counterpart, yet the wait-period for their first switch-like torque response changed greatly between the trials (4/18 flies behaved this way). The experimental settings were kept identical, but the flies “motivation” to perform varied greatly. In the worst case, we could only test this paradigm twice, before the fly lost “interest” and stopped flying. In the best case, the experiment was repeated 20 times. (C) Time-to-choice statistics of the flies are skewed with a heavy tail. As there was no real difference in the variable onset between the left and right responses, these results are pooled. Notice, that sometimes it took a fly for over a second to initiate orientation toward its chosen stimulus.

