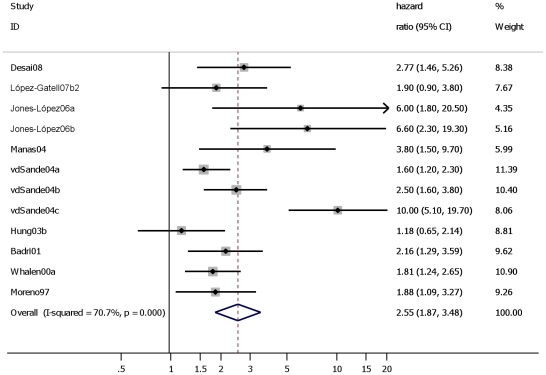
Figure 5. Studies assessing the effect of “prevalent”, “incident” and “prevalent”+“incident” TB on all cause mortality in HIV positive individuals before HAART era (<1996) or ≤10% of cohort has reported use of HAART.
Study ID on the Y-axis refers to first author and publication year; % weight refers to influence of each study on overall estimate (weights are from fixed effect analyses); for each study the central diamond indicates multivariate hazard ratio, line represents 95% confidence interval (CI), and the grey square reflects the study's weight in the pooling; overall estimate refers to pooled estimate of hazard ratio after mathematical combination of all studies; the X-axis indicates the scale and the direction of the effect of tuberculosis on mortality in HIV positive individuals.

