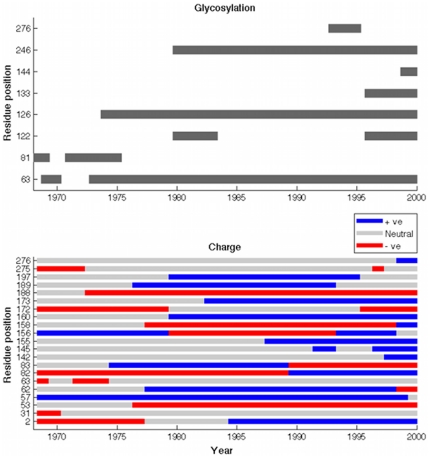
Figure 5. Estimated timing of major charge and glycosylation events.
In the lower panel, grey bars denote the presence of an N-glycosylation sequon in at least 10% of sequences in a year. Note that where there are only few samples in a year, as depicted in Figure S1, estimates in both panels become less reliable.

