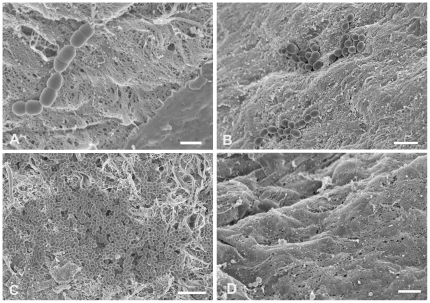
Figure 2. Increase in Asc10+ E. faecalis aggregate size on valve tissue over time.
Scanning electron micrographs of E. faecalis Asc10+ OG1SSp (pCF10) incubated with heart valve segments for 0.5 h (A), 2 h (B), and 4 h (C), showing noticeable enlargement of bacterial aggregates over time, an observation compatible with biofilm formation. Part A also highlights preferential adherence of E. faecalis to areas of noticeable tissue damage, as opposed to areas where the tissue appears more intact (lower right of photograph). An uninfected valve is shown in part D, where the tissue is mostly intact, compared to the other panels in the presence of bacteria. Scale bars: A, 1 µm; B, 2 µm; C, 4 µm; D, 1 µm.

