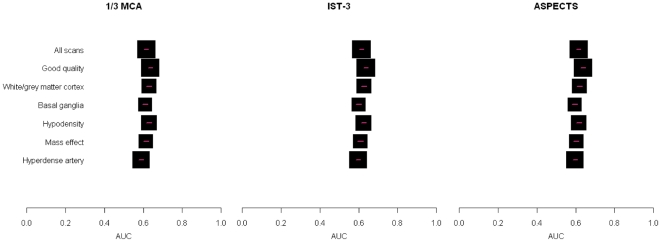
Figure 2. Agreement between observers and the reference standard by scan features.
A box and whisker plot is shown for each of the 1/3 MCA, IST-3 and ASPECTS scales, with the scan features listed on the left hand side. Each box and whisker represents the point estimate of the area under the curve (AUC, on x-axis, box) and 95% confidence intervals (whisker) for the observers in that group compared with the reference standard.

