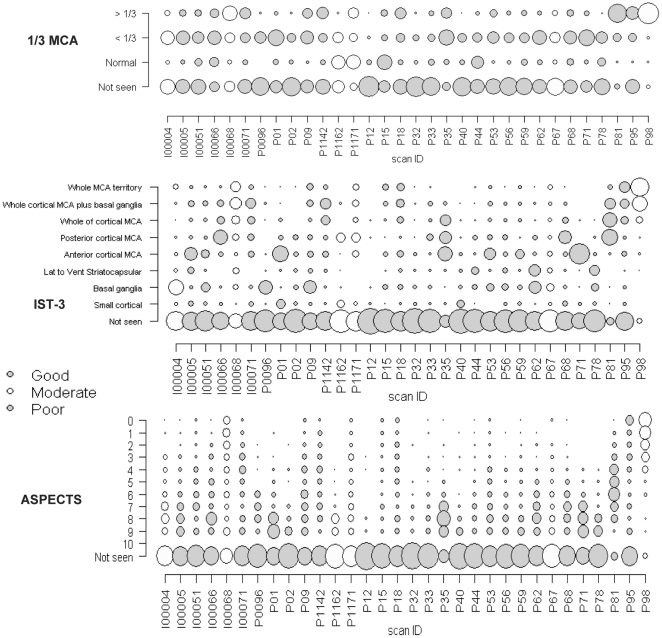
Figure 3. “Bubble plots” show observers' score distributions for each scan for each scoring method.
The three scoring methods are the 1/3 MCA, IST-3 and ASPECTS scores. X axis indicates the individual scan identification numbers, the Y axis indicates the scores on each scale, and the scan quality as judged by the reference standard is indicated in blue (poor), moderate (yellow) or good (red).

