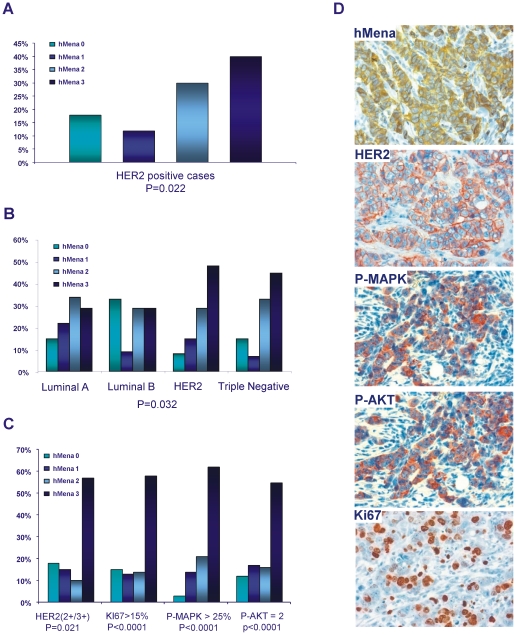
Figure 1. hMena is differently distributed among breast cancer subtypes and correlates with HER2 overexpression, MAPK, AKT activity and Ki67.
A. Relationship between hMena staining and HER2 positivity in human breast carcinomas. Histograms represent the percentage of the hMena staining (score 0; 1; 2; 3) in 82 HER2 positive breast cancer samples (2+ with gene amplification and 3+) (p = 0.02). B. hMena distribution within 286 human breast carcinomas grouped according to molecular subtypes. hMena expression (0, 1, 2, 3 scores) in Luminal A, Luminal B, HER2 subtypes and Triple Negative. The percentage of hMena-positive cases (score 3) is significantly higher in the HER2 subtype and Triple-Negative in comparison to Luminal A and Luminal B breast cancer (p = 0.032). C. Correlation between hMena expression and HER2, P-AKT, P-MAPK and Ki67 in a subgroup of 178 breast cancer patients. Percentage of HER2 positivity, high Ki67 proliferation index, elevated P-AKT and P-MAPK expression for each hMena score. The percentage of HER2 positivity (p = 0.016), P-AKT (p<0.001) and P-MAPK (p<0.001) overexpression, high Ki67 proliferation index (p = 0.016) increase significantly in relationship to hMena score (0 to 1 to 2 to 3). D. Representative case of an invasive ductal carcinoma with a strong hMena positivity (score 3+) displaying HER2 overexpression (score 3 by IHC), P-MAPK and P-AKT positivity, elevated Ki67 index. Magnification, 40x. Original scale 1 cm = 30micron (25 cm×33 cm).

