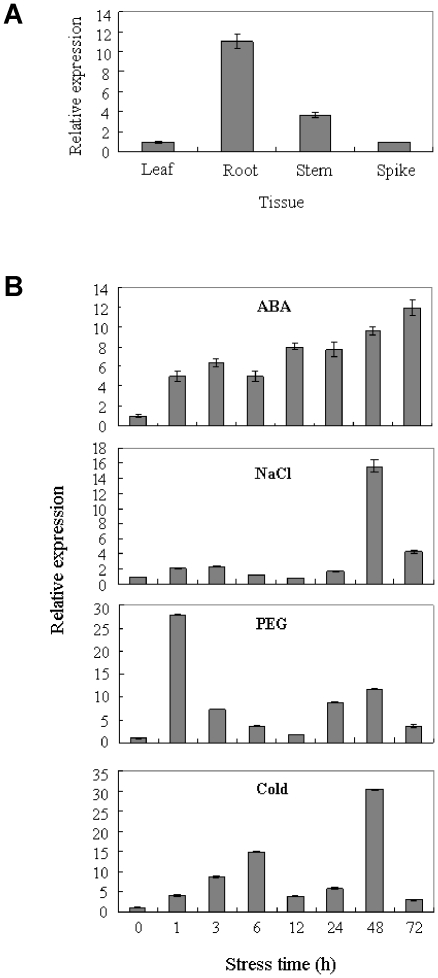
Figure 4. Expression patterns of TaSnRK2.8 in various tissues and in response to various stresses.
(A) Expression patterns of TaSnRK2.8 in different wheat tissues. (B) Expression patterns of TaSnRK2.8 under various stress conditions. Tubulin was used as an internal control. The vertical column indicates the relative transcript level. Data represent means ±SD of three replicates.

