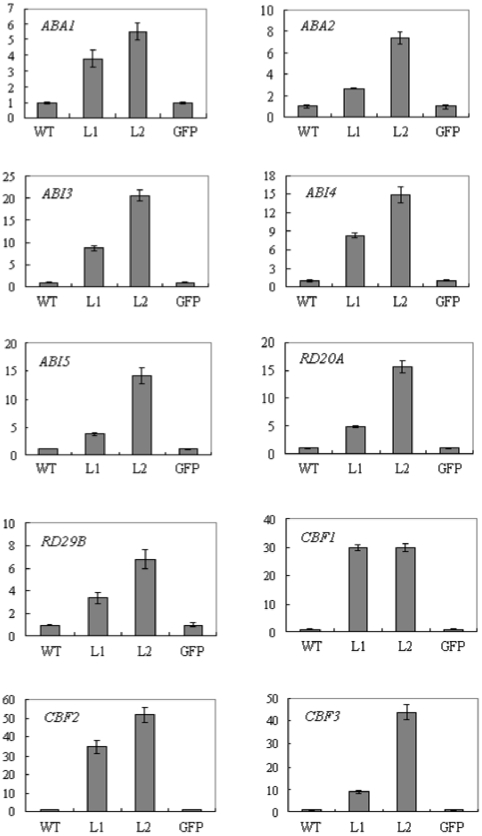
Figure 9. Comparisons of the relative transcript levels of ABA1, ABA2, ABI3, ABI4, ABI5, RD20A, RD29B, CBF1, CBF2 and CBF3 in TaSnRK2.8 plants and WT/GFP control under normal conditions.
Actin was used as an internal control. The vertical column indicates the relative transcript level. Data represent means ±SD of three replicates.

