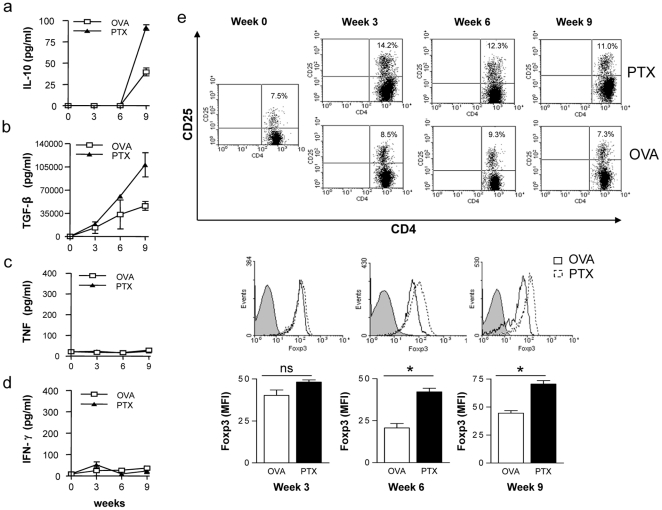
Figure 4. C57Bl/6 mice received weekly i.v. injections with 300 ng PTx or OVA 323–339 (control) in PBS.
Serum cytokine IL-10 (a), TGF-β (b), TNF (c) and INF-γ (d) were determined at week 0-3-6-9 post PTx treatment. CD4+CD25+FoxP3+ Treg were analysed by flow cytometry at week 0-3-6-9 post PTx treatment (e; upper panels: indicated is the percentage of CD4+CD25+ within all CD4+ T cells; middle panels: FoxP3 expression of CD4+CD25+ cells; lower panels: mean FoxP3-FITC fluorescence intensity of CD4+CD25+ cells, * indicates p<0.05) (3 mice/group/time point; representative for three separate experiments).

