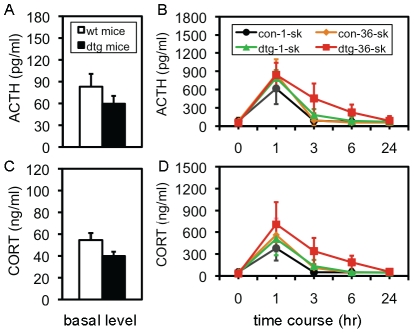
Figure 6. Increased HPA axis activity in tg mice following 36 trials of footshock.
(A) Basal serum level of ACTH in naïve control mice (con-naïve) and naïve tg mice (tg-naïve). A tendency of a lower level is shown, but it is not significant. Data are expressed as mean ± SEM. (B) Time-course of ACTH response following 1 or 36 trials of footshock. Control-1-shock mice (con-1-sk), control-36-shock mice (con-36-sk), tg-1-shock mice (tg-1-sh), and tg-36-shock mice (tg-36-sk) were examined. A repeated ANOVA showed: A: F(3,34) = 11.79; B: F(4,136) = 231.16; A×B: F(3,12) = 5.124, all with p<0.001, indicating a robust interaction. Detailed post-hoc analyses are described in the text. (C) Basal serum level of CORT in naïve control mice (con-naïve) and naïve tg mice (tg-naïve). A tendency of a lower level is shown, but it is not significant. Data are expressed as mean ± SEM. (D) Time-course of CORT response following stresses. The same groups of mice above were examined. A repeated ANOVA showed: A: F(3,34) = 7.33, p<0.001; B: F(4,136) = 5.16, p<0.001; A×B: F(3,12) = 2.663, p<0.01, indicating a robust interaction. Detailed post-hoc analyses are described in the text.

