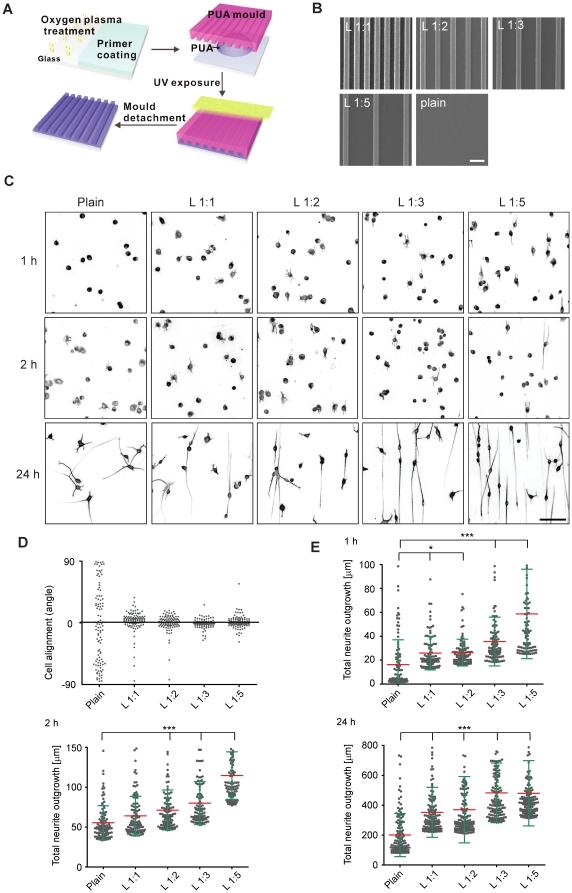
Figure 1. Neurite outgrowth response on nanotopographic pattern.
(A) Schematics of nanopattern fabrication. (B) SEM images of PUA nanopattern with different ridge/groove ratios. (C) Representative images of tubulin-stained N1E-115 cells allowed to extend neurites on different plain and line patterns for 24 hours. (D) Quantification of neurite orientation at 24 hours. Angle measurements of neurite orientation compared to an arbitrary (plain substrate) or to the line direction (line substrate) are shown. Data is based on more than 100 cells for experiment. (E) Cumulative graph of the 20 percentile highest total neurite lengths on a per cell basis. Mean (red) and standard deviations (green) are shown. Data is based on 140 cells of 700 cells for each group. P values (Anova) between plain and line substrates <<0.0001 except 2 hours of line 1∶1 (no significance). Bars: (B) 1 µm; (C) 200 µm.

