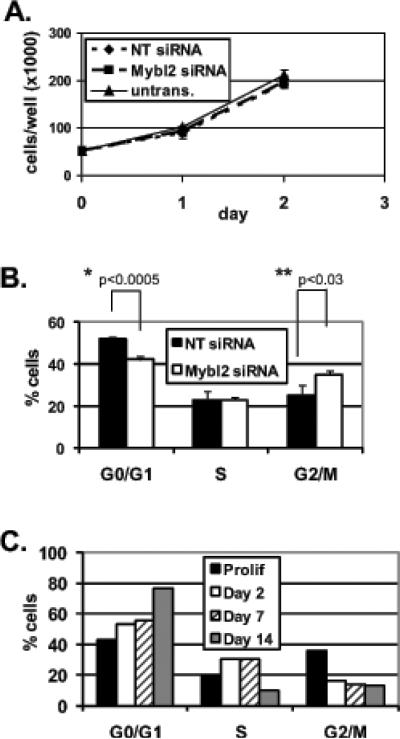
Figure 5.
(A) Proliferation of untransfected and Mybl2 or nontargeting (NT) siRNA-transfected Caco-2 cells was measured by counting cells at 24 hour intervals. (B) DNA content in siRNA-treated cells was measured by propidium iodide staining and flow cytometry as described in Materials and Methods, and cell-cycle distributions were calculated with ModFit software. Graph indicates quantitation of cells in each cell cycle phase. (C) Quantitation of cell cycle distributions in populations of proliferating and day 2, day 7, and day 14 spontaneously-differentiated Caco-2 cells. Asterisks indicate p values for Student's 2-tailed T-tests.

