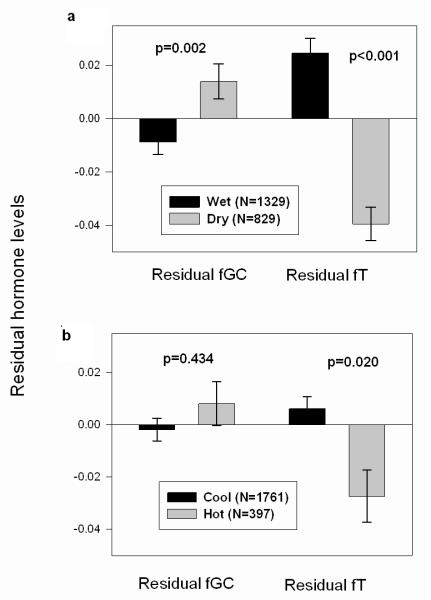
Figure 1.
Differences in fGC and fT concentrations in (a) wet vs. dry se ason and (b) cool vs. hot months. The y axis represents the residual fGC or fT values obtained from the GLMM, which included all the predictors listed above in Table 1 except for the variable of interest (see Methods). Each value represents the mean ± SE across male monthly averages. N represents the number of monthly averages. Statistical significance was determined using the Mann Whitney U.

