Figure 1.
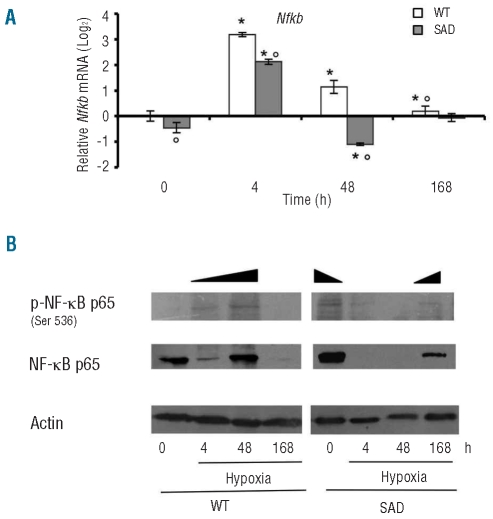
(A) Quantitative RT-PCR expression profile of Nfkb, in laser captured hepatocytes from WT mice and SAD mice exposed to I/R stress under normoxia (time 0) and hypoxia (4, 48, and 168 h) followed by 2 h of reoxygenation. Data are presented as means ± SD, n =6–7/group; * P<0.05 compared to baseline values; °P<0.05 compared to WT mice; ^ P< 0.05 compared to untreated SAD mice. The gene expression levels recorded after different experimental conditions were normalized using the average of the expressions of Gapdh and rRNA18s as an endogenous reference. Data were calculated by the comparative method. (B) Immunoblot analysis with specific anti-phospho-NF-κB p65 and anti-NF-κB p65 antibody of hepatocytes from WT and SAD mice under normoxia (time 0) and hypoxia (4, 48, and 168 h) followed by 2 h of reoxygenation. A representative experiment of six performed with similar results is shown.

