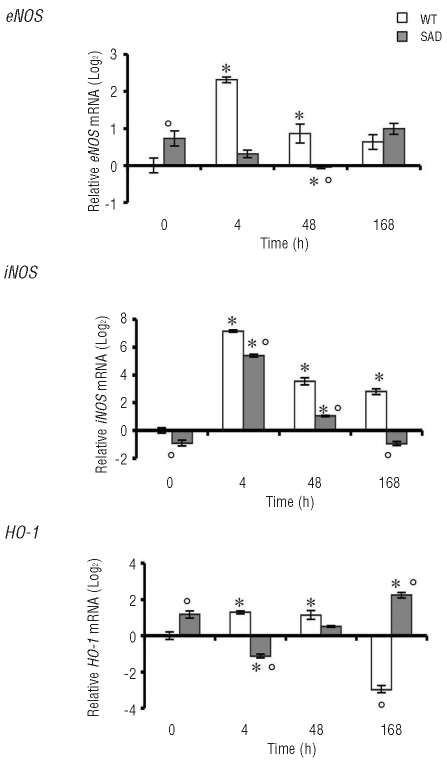
Figure 2.
Quantitative RT-PCR expression profile of eNOS (endothelial NO synthase), iNOS (inducible NO synthase), and HO-1 (heme oxygenase-1), in laser-captured hepatocytes from WT mice and SAD mice under normoxia (time 0) and hypoxia (4, 48, and 168 h) followed by 2 h of reoxygenation. Data are presented as means±SD, n =6–7 mice/group; * P<0.05 compared to baseline values; °P<0.05 compared to WT mice. For each gene, the expression levels found after different experimental conditions were normalized using the average of the expressions of Gapdh and rRNA18s as an endogenous reference. Data were calculated by the comparative method.

