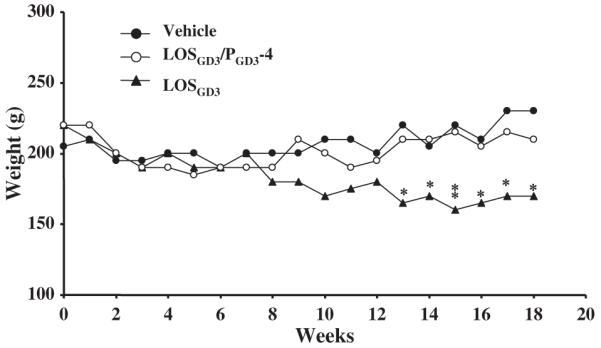
Fig. 3.

Changes in body weight after sensitization by LOSGD3. The graph shows body weight after vehicle-treatment (●), LOSGD3/PGD3-4-treatment (○), and LOSGD3-treatment (▲) of the week-12 rats. According to two-way ANOVA and Tukey’s test, there is a significant reduction in body weights of the LOSGD3-treated group compared with the vehicle-treated group from week-13 to -18 post-treatment. PGD3-4 treatment maintained weight at the vehicle-treated group level. There was significant difference of body weight compared LOSGD3-treated group by unpaired t-test of Student (*p < 0.05, **p < 0.01).
