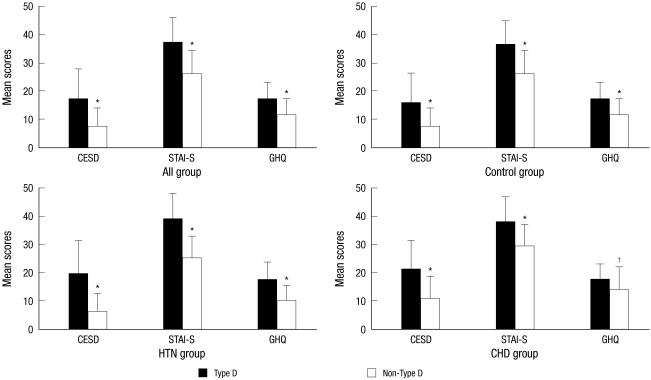
Fig. 1.
Mean scores on the measures compared between Type D and non-Type D. Standard deviations are presented on top of bars, *P < 0.001; †P < 0.05. CESD, Center for Epidemiologic Studies Short Depression Scale; STAI-S, Spielberger State and Trait Anxiety Inventory-state; GHQ, General Health Questionnaire/Quality of Life -12; CHD, coronary heart disease; HTN, hypertension.

