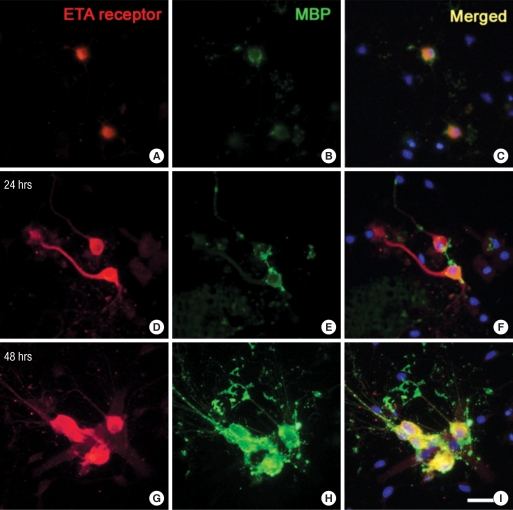
Fig. 4.
Fluorescent double labeling for the ETA receptor and MBP in primary OPCs after ET-1 treatment. The ETA receptor was expressed in a few cells of OPC cultures (A-C). Myelination was assessed by immunostaining with an antibody against MBP, a marker of mature oligodendrocytes. OPCs were treated with ET-1 (100 nM). ETA receptor/MBP positive cells increase at 24 and 48 hr after treatment with ET-1 (D-I). Scale bar = 20 µm.

