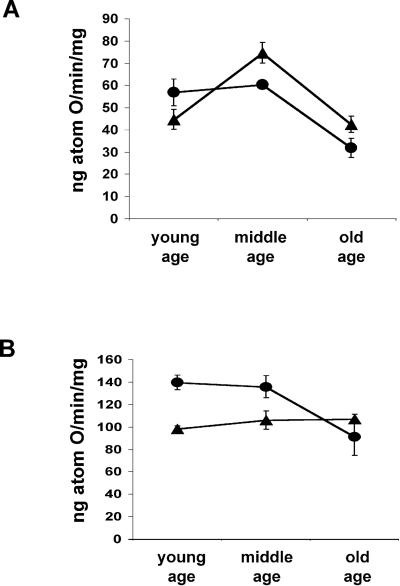
Figure 4.
Mitochondrial oxygen consumption in aging Sod2tm1Cje (+/−) and (+/+) mouse livers. (A) State IV rates of aging Sod2tm1Cje (+/−) (▴) and controls (●). (B) State III (ADP-stimulated) rates of aging Sod2tm1Cje (+/−) (▴) and controls (●). Data shown are the means and standard errors for four to six independent experiments.

