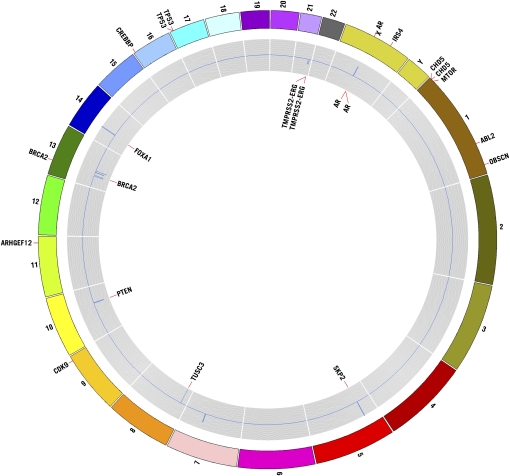
Figure 1.
Circos plot illustrating copy number alterations and genes affected by somatic mutation. Regions affected by focal copy number events are plotted within the gray inner circle with deleted regions deviating below copy neutrality (toward center) and amplified regions deviating above copy neutrality. Key genes mapping within copy number alterations are annotated within the innermost portion of the plot. Genes affected by somatic nonsysnonymous mutation are shown at their proper map positions on the outermost area of the Circos plot.

