Figure 4.
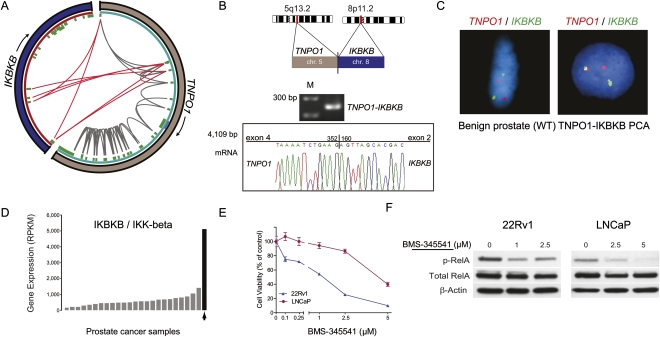
Characterization of the TNPO1–IKBKB gene fusion candidate. (A) Mapping of PE RNA-seq reads to TNPO1 with either or both ends mapping to TNPO1 (gray) or one end mapping to IKBKB (red). (B) Experimental validation by RT-PCR and Sanger sequencing verifies the expression of a TNPO1–IKBKB fusion transcript. (C) Fusion specific FISH assays confirm the existence of TNPO1–IKBKB fusion in cancer tissue (right) but not in adjacent benign tissue (left). (D) IKBKB expression levels in a set of 25 prostate cancers. IKBKB levels are highest in the fusion positive sample (black). (E) Dose response curve assessing the effect of the IKK-beta inhibitor BMS-345541 on viability of LNCaP and 22Rv1 prostate cancer cells. (F) Immunoblots depicting the effect of BMS-345541 exposure on RelA phosphorylation in LNCaP and 22Rv1 cells.

