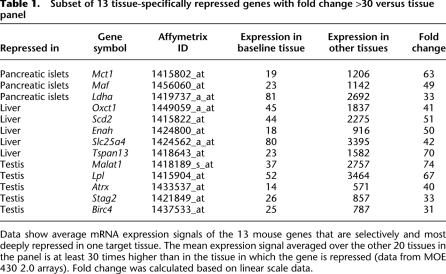
Table 1.
Subset of 13 tissue-specifically repressed genes with fold change >30 versus tissue panel
Data show average mRNA expression signals of the 13 mouse genes that are selectively and most deeply repressed in one target tissue. The mean expression signal averaged over the other 20 tissues in the panel is at least 30 times higher than in the tissue in which the gene is repressed (data from MOE 430 2.0 arrays). Fold change was calculated based on linear scale data.

