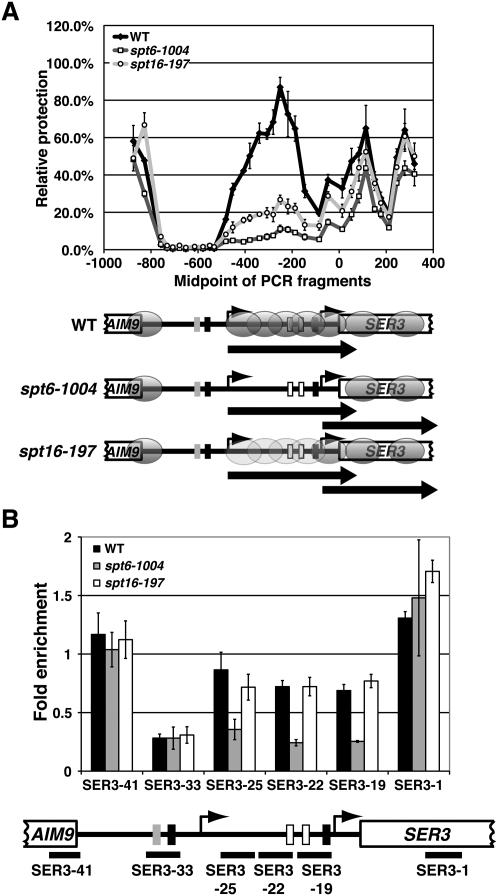
Figure 4.
Nucleosome positions and relative occupancy at SER3 in spt6-1004 and spt16-197 mutants. (A) Nucleosome scanning assay was performed on wild-type (FY2134, YJ864, and YJ847), spt6-1004 (FY2180, YJ855, YJ862), and spt16-197 (FY346, YJ859, and YJ916) strains that were grown in YPD at 30°C as described in Figure 1. The light-gray ovals over the SRG1 transcription unit in the spt16-197 strain reflect that this region is slightly more protected from MNase digestion as compared with the spt6-1004 strain. (B) Histone H3 ChIP was performed on chromatin isolated from wild-type (FY4, FY5, and YJ586), spt6-1004 (YJ886, YJ887, and YJ888), and spt16-197 (YJ844, YJ845, and YJ846) cells that were grown in YPD. The amount of immunoprecipitated DNA was determined by qPCR as a percentage of the input material and is expressed as the fold enrichment over GAL1 NB (see Supplemental Fig. S1). Each bar represents the mean ± SEM of at least three independent experiments. Below the graph is a schematic of SER3 with black bars corresponding to the regions amplified by qPCR (see Supplemental Table S2 for details).

