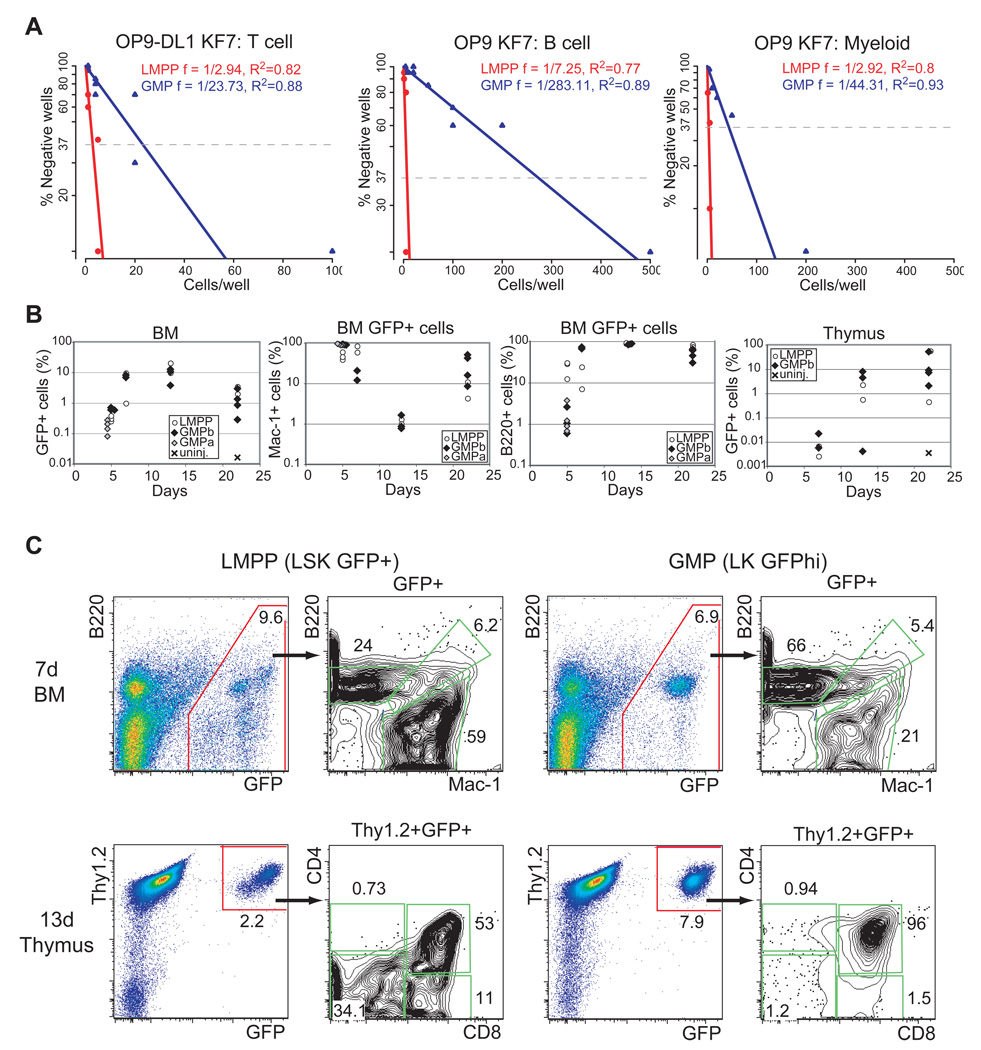
Figure 3. Latent lymphoid potential in the GMP.
(A) Limiting dilution analysis of GMP and LMPP for T cell, B cell and myeloid differentiation potential. Cells were sorted at the indicated doses and co-cultured with OP9-DL1 for 14–18 days and with OP9 for 8–11 days under conditions that promote T cell, B cell and myeloid differentiation before FACS analysis for lineage markers. Frequencies of T cell, B cell differentiation were calculated using Pöisson statistics. Analysis of combined data from four independent experiments is shown. R2 values are provided for each progenitor analysis. (B) 2000 LMPP (white circle), 7,500 GMP (a-grey diamond) or 30,000 GMP (b-black diamond,) were intravenously injected into sublethally irradiated recipient mice. Total and lineage- specific (Mac-1+, B220+, Thy1.2+) donor contribution (GFP+) was measured at days 5, 7, 13 and 22 post-injection. For every time point 2–4 mice per group were analyzed. (C) Representative LMPP and GMP donor contributions in the myeloid and B cell lineage (Mac-1+ vs. B220+) in the bone marrow at day 7 post-transplantation. LMPP and GMP contributions (GFP+Thy1.2+) to CD4 vs. CD8 profiles in the thymus is also shown at day 13 post-transplantation.

