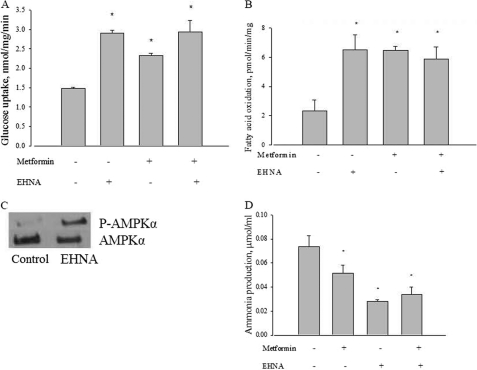
FIGURE 8.
Effect of EHNA, metformin, or both on glucose uptake in L6 myotubes. A, L6 cells were incubated with 5 mm glucose with or without 10 mm metformin, 100 μm EHNA, or both for 2 h, and then glucose uptake was measured as described under “Experimental Procedures.” *, p < 0.05 versus control. B, effect of EHNA, metformin, or both on palmitate oxidation in L6 myotubes. L6 cells were incubated with 120 μm palmitic acid with or without 10 mm metformin, 100 μm EHNA, or both for 3 h, and then palmitate oxidation was measured as described under “Experimental Procedures.” *, p < 0.05 versus control. C, effect of EHNA on AMPKα phosphorylation in L6 myotubes. L6 cells were incubated with or without 100 μm EHNA for 2 h, and then AMPKα phosphorylation at Thr172 was measured by Western blot; AMPKα was used as a control. P-AMPKα, phosphorylated AMPKα. AMPKα and P-AMPKα were probed with separate selective antibodies. D, effect of EHNA on ammonia production in L6 myotubes. L6 cells were incubated with 5 mm glucose with or without 100 μm EHNA for 2 h, and then ammonia production was measured as described under “Experimental Procedures.” *, p < 0.05 versus control. Data are expressed as per mg of cellular protein.

