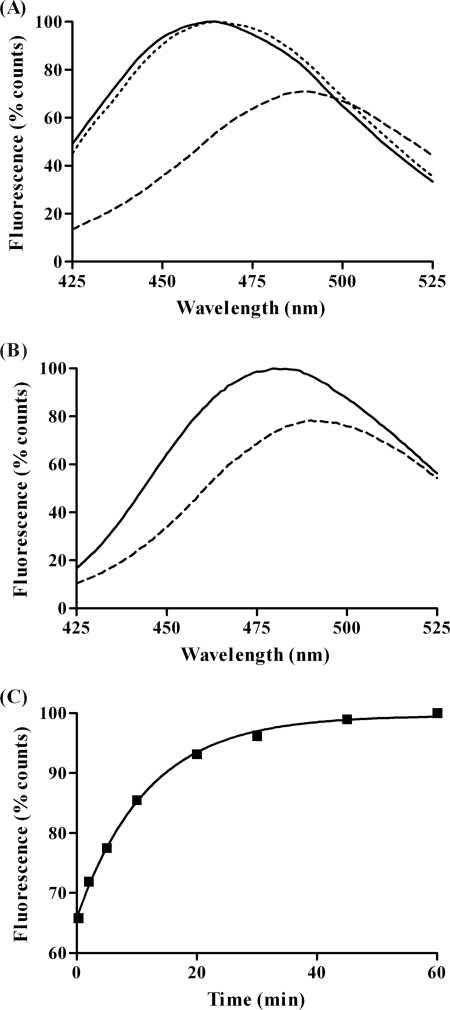
FIGURE 2.
A, fluorescence emission spectra of AcrylAct1NAT (- - -), AcrylAct1I3 (—), and AcrylAct1-CCT (···) exciting at 380 nm; B, polymerization of AcrylAct1: fluorescence emission spectra of AcrylAct1 immediately after addition of MgCl2 and ATP (- - -) and after a 10-min polymerization (—); C, representative scan showing the change in acrylodan emission at 470 nm as AcrylAct1 is unfolded in the presence of 10% (v/v) glycerol.

