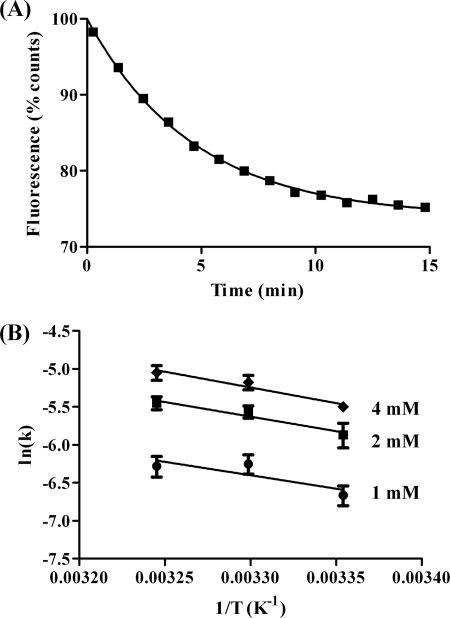
FIGURE 4.
A, representative scan of fluorescence emission of AcrylAct1 at 470 nm following release from CCT with 2 mm ATP, 10 mm MgCl2, fitted to a single exponential to allow the rate constant k to be determined; B, Arrhenius plot of the rate constants for release of AcrylAct1 from CCT with 1 mm ATP, 5 mm MgCl2 (circles), 2 mm ATP, 10 mm MgCl2 (squares), or 4 mm ATP, 20 mm MgCl2 (diamonds). Error bars show the standard deviation.

