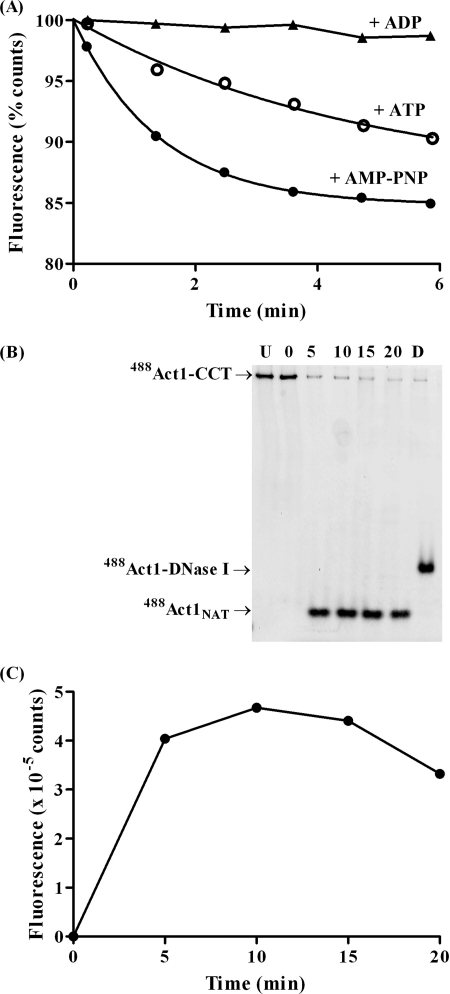
FIGURE 6.
A, representative scans of the fluorescence emission at 470 nm for incubation of AcrylAct1-CCT with AMP-PNP followed by addition of ADP (triangles), and release of AcrylAct1 from CCT by addition of ATP following preincubation in the presence (solid circles) or absence (open circles) of AMP-PNP; B, in-gel fluorescence of a native gel showing release of 488Act1 from CCT, showing 488Act1 unfolded onto CCT (U), then incubation of this complex for 10 min with AMP-PNP and time points following addition of ATP to allow release of 488Act1NAT; C, quantification of the 488Act1NAT band from the gel (B).

