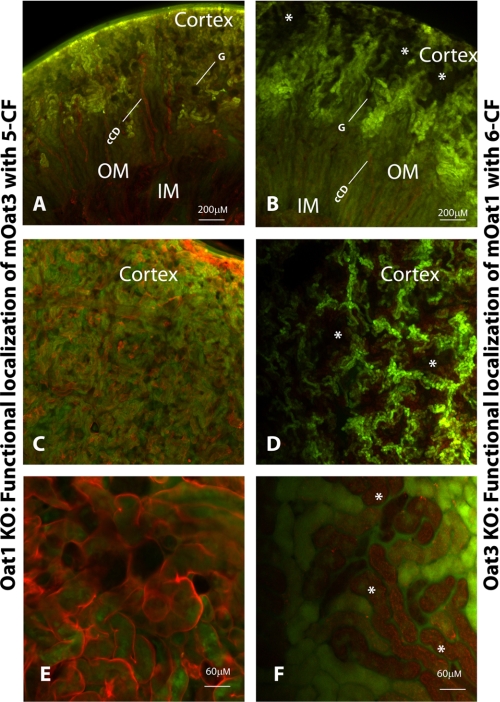
FIGURE 2.
Localization of fluorescent tracer 5CF in oat1 knock-out and fluorescent tracer 6CF in oat3 knock-out as a function of OAT3 and OAT1, respectively. Photomicrographs show coronal sections of adult kidney from oat1 KOs (A, C, and E) and OAT3 KOs (B, D, and F). A, C, and E, examination of 5CF uptake (green) in adult oat1 KOs co-stained with either D. biflorus lectin (red) (A) or Lotus lectin (red) (C and E). B, D, and F, examination of 6CF uptake (green) in adult oat3 KOs co-stained with either D. biflorus lectin (red) (B) or Lotus lectin (red) (D and F). cCD, cortical collecting duct; G, glomerulus; OM, outer medulla; IM, inner medulla. The asterisks indicate occlusions in the pattern of tracer uptake. mOat, mouse OAT. Scale bars = 200 μm in A–D and 60 μm in E and F.

