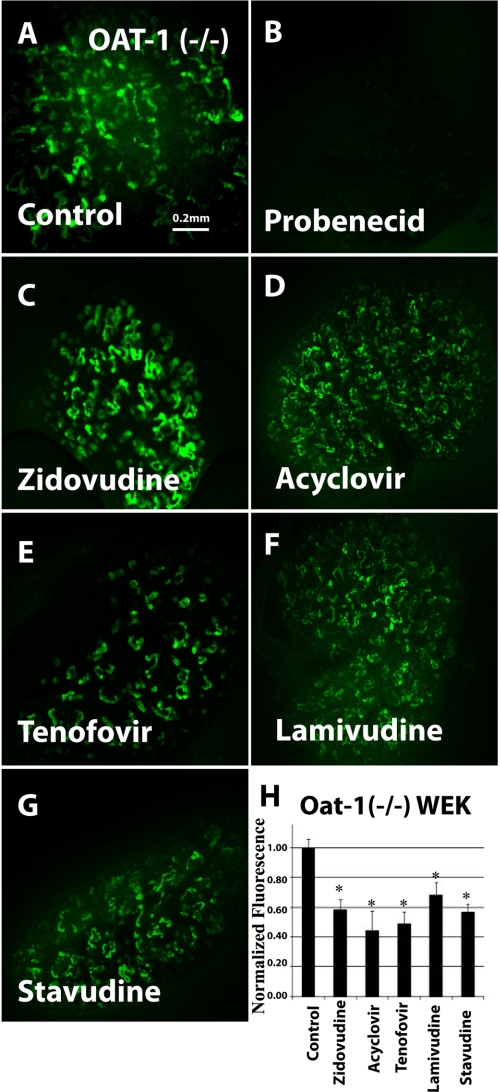
FIGURE 5.
Inhibition of 6CF uptake by antivirals in cultured oat1 knock-out embryonic kidneys in organ culture (function of OAT3). Fluorescent photomicrographs show 6CF (1 μm) uptake in cultured oat1 knock-out embryonic kidneys in the presence of a vehicle control (A), 2 mm probenecid (B), 100 μm zidovudine (C), 200 μm acyclovir (D), 100 μm tenofovir (E), 200 μm lamivudine (F), and 1 mm stavudine (G). Images are representative of triplicate embryonic kidney cultures. The bar graph (H) shows relative fluorescent signal strength of 6CF in cultured embryonic kidneys derived from quantitative image analysis. WEK, whole embryonic kidney. Scale bar = 0.2 mm. *, p < 0.05.

