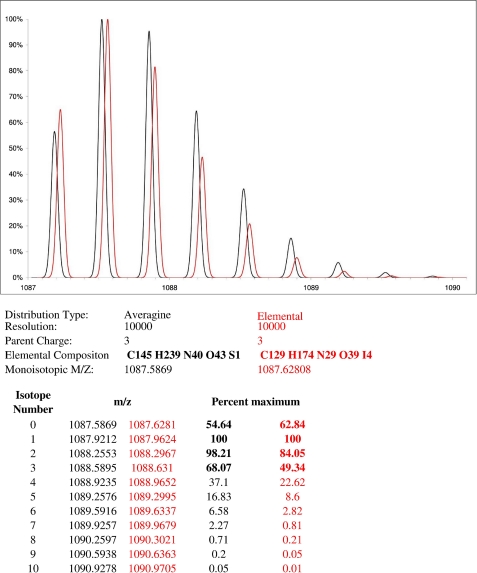
FIGURE 3.
Specific ion pattern for peptide containing the thyroxine modification. This figure was constructed using Protein Prospector software with default resolution set to 10,000. This parameter has no effect on the ratios of the two isotopic patterns shown here. The relative height is shown for the first isotopes of an “Averagine peptide” (black line) with a molecular mass of 1087.5869 and the iodinated peptide (red line) (ILAAVWYYSLEHSTDDYAFSR) containing a thyroxine modification at Tyr2572 with a molecular mass of 1087.6808. The elemental composition and characteristics of these two chemical entities are given below, as well as the calculated values for isotopic distribution. The isotopic distribution of iodinated peptide is different from that of noniodinated peptide with a similar mass. The effect of 4 iodine atoms should not be ignored, otherwise this type of iodinated pattern would not be recognized as a peptide pattern.

