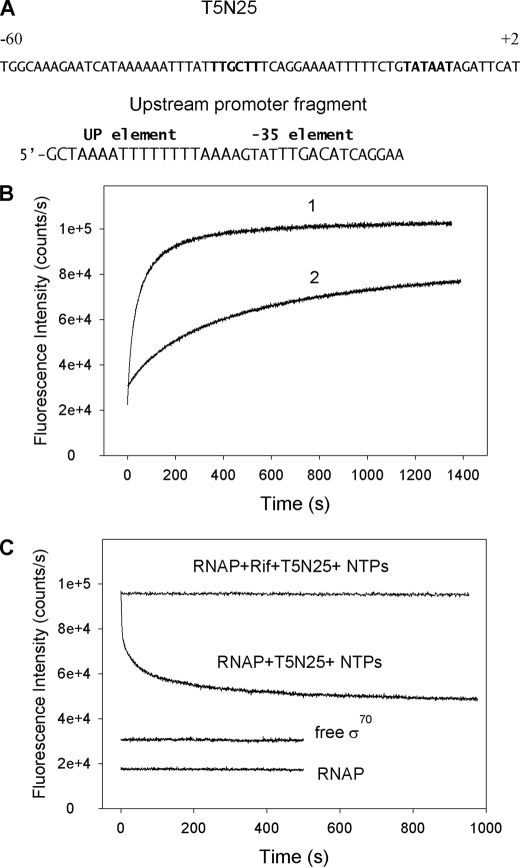
FIGURE 2.
Measuring RNAP-promoter DNA interactions using the protein beacon assay. A, top strand sequences of the T5N25 promoter from position −60 to +2 and the model upstream promoter fragment are shown with the −35 and UP promoter element sequences indicated. B, curve 1, time dependence of the increase in fluorescence upon mixing 1 nm (211Cys-TMR) σ70 holoenzyme with 2 nm T5N25 DNA fragment. Curve 2, same as curve 1, but (211Cys-TMR) σ70 holoenzyme was preincubated with 100 nm upstream promoter fragment for 5 min prior to the addition of T5N25 DNA. C, time-dependent change of the fluorescence signal upon addition of a mixture of ATP, GTP, and UTP (to a final concentration of 0.5 mm each) and 10 nm of unlabeled wild-type σ70 to complexes of the T5N25 DNA fragment with (211Cys-TMR) σ70 holoenzyme preformed with and without 1 μm rifampicin.

