
FIGURE 7.
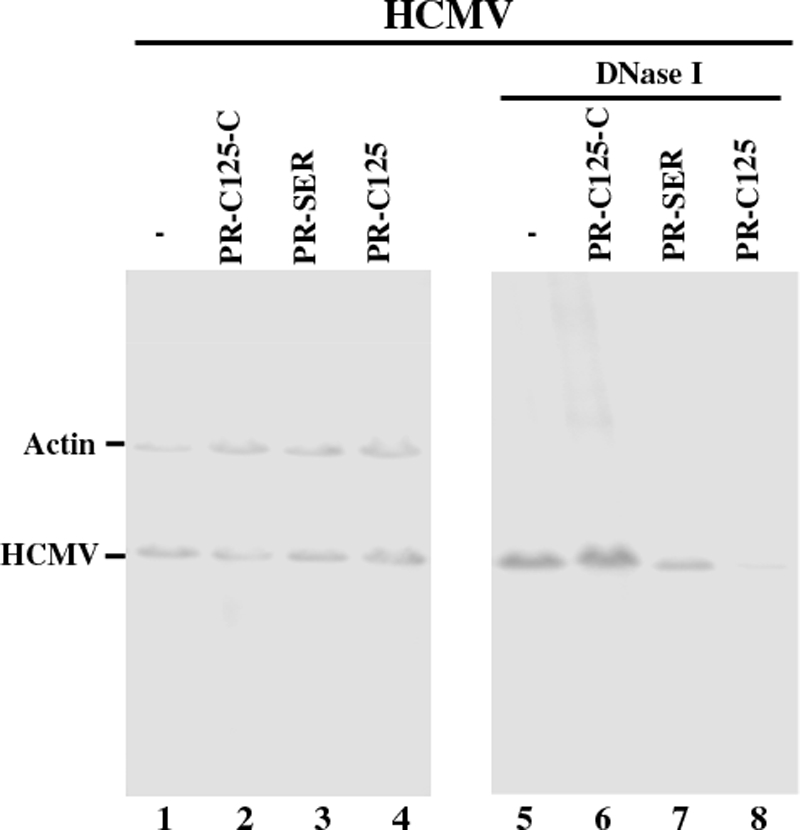
Level of total intracellular (left) and encapsidated (right) viral DNA as determined by semi-quantitative PCR. Total DNA (lanes 1–4) or DNase I-treated DNA samples (lanes 5–8) were isolated from cells that either did not express an EGS (−, lanes 1 and 5) or express EGS PR-C125-C (lanes 2 and 6), PR-SER (lanes 3 and 7), or PR-C125 (lanes 4 and 8). Cells were infected with HCMV at m.o.i. of 1. The levels of viral IE1 sequence was determined by PCR using human actin DNA sequence as the internal controls.