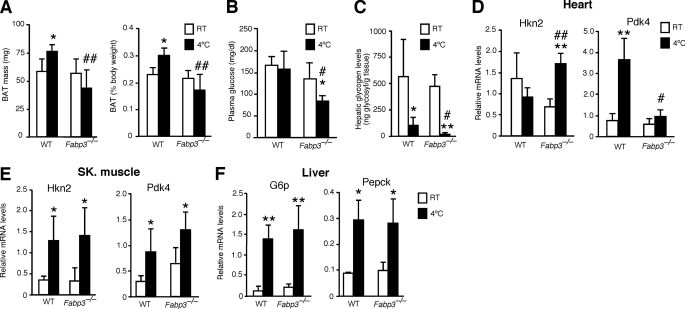
FIGURE 5.
Lipid and glucose metabolism during cold exposure in wild-type (WT) and Fabp3−/− mice. A, BAT mass at room temperature and after 4 h at 4 °C, expressed as milligrams of body weight and as percent of body weight. B, plasma glucose levels. C, glycogen levels in liver. Glycogen was extracted from frozen tissues and hydrolyzed. Levels correspond to glycosyl molecules per g of tissue. D, induction of glycolytic gene expression in heart of Fabp3−/− mice after cold exposure. Hkn2, hexokinase II; Pdk4, pyruvate dehydrogenase kinase 4. E, glycolytic gene expression in skeletal muscle. F, induction of glucose synthesis gene expression in liver after cold exposure. G6p, glucose-6-phosphatase; Pepck, phosphoenolpyruvate carboxykinase. Open and black bars represent room temperature (RT) and 4 h at 4 °C, respectively. *, p < 0.05, and **, p < 0.01, compared with room temperature. #, p < 0.05, and ##, p < 0.01, compared with wild-type mice at the same temperature. Data represent the mean ± S.D. (n = 4).

